
Introduction
Organizations lose over $1.5 trillion each year on training that doesn’t drive lasting performance. This playbook reveals how to deploy digital and blended learning ecosystems that cut costs by up to 75%, increase product adoption by 38%, raise productivity by 32%, and deliver a 353% ROI.
You will uncover 10 proven actions—complete with hands-on tools, templates, and timelines—that will help you turn L&D into a revenue-driving growth engine in just 90 days.

Step 1: Pinpoint Business Outcomes

Start with revenue-critical gaps, not training needs. Executives approve budgets when L&D directly impacts P&L.
- Identify outcomes that move needles like sales velocity, customer retention, compliance risk reduction, or product feature utilization
- Quantify baselines using existing data (CRM reports, app analytics, audit logs)
- Set aggressive but achievable 90-day targets. Prioritize one outcome to focus pilot efforts—spreading thin dilutes results
94% of C-suite leaders reject generic “skill development” requests but approve 85% of proposals tied to specific revenue or risk metrics.
Outcome Canvas Worksheet
| Outcome | Impacted Teams | Baseline Metric | 90-Day Target | Measurement Source | Owner |
|---|---|---|---|---|---|
| Boost feature usage | Sales + CS | 40% active users | 78% active users | App analytics dashboard | CS Lead |
| Shorten ramp time | New hires | 180 days | 90 days | CRM deal progression | Sales Ops |
Action: Gather your leadership team for a 30-minute alignment session. Complete the Outcome Canvas worksheet by pulling baseline metrics from CRM, app analytics, or audit reports. Select your single primary outcome and circulate the completed canvas to all stakeholders for sign-off.
Step 2: Map Skills To Workflow Moments

Break outcomes into 3-5 micro-skills that top performers execute effortlessly.
- Pinpoint exact workflow triggers where failure occurs (first customer demo, system login, compliance alert)
- Document current pain points with data—62% demo drop-off, 48-hour breach reporting delays
- Map creates content GPS: every module targets a specific moment, ensuring relevance and application
Contextual learning boosts retention 70% vs abstract training. “Learning in the flow of work” cuts onboarding time by 60% by meeting learners where failures occur.
Skills & Moments Matrix
| Outcome | Core Skill | Workflow Trigger | Current Failure Mode | Data Source |
|---|---|---|---|---|
| Feature adoption | Clear demo delivery | First customer meeting | 62% drop-off post-demo | Recordings |
| Compliance mastery | Breach response | Incident alert | Delayed reporting (48 hrs avg) | Ticket system |
Action: Interview your top 3 performers (15 minutes each) to identify what they do differently. Review recent failure data from CRM, support tickets, or audit logs. Complete the Skills & Moments Matrix for your primary outcome, then validate findings with one manager from each impacted team within 48 hours.
Step 3: Match Formats To Skill Types

Digital learning scales knowledge efficiently. Lasting behaviour change, however, depends on human reinforcement. Use this matrix to guide investment—allocate roughly 70% of your budget to scalable digital programs and 30% to blended experiences that drive deeper impact.
Use pure digital formats for tool proficiency, systems navigation, and procedural training. Reserve blended learning for developing sales capability, leadership behaviours, and sound judgment. Live-only sessions should be limited to critical situations such as legal certifications or crisis response.
Decision Logic:
- Digital Priority: Factual recall, system demos, compliance refreshers
- Blended Priority: Role-plays, objection handling, decision frameworks
- Live Only: Legal testimony prep, physical safety drills
Format Decision Matrix
| Skill Type | Digital Priority | Blended Priority | Live Only | Budget % | Timeline |
|---|---|---|---|---|---|
| Tool navigation | Launch micro paths | Add in-app nudges | Skip | 80% digital | 2 weeks |
| Sales objection handling | Build VR sims | Layer group coaching | Essential | 40/60 split | 6 weeks |
| Regulatory judgement | Create scenarios | Mandatory debriefs | Required | 30/70 split | 8 weeks |
Action: Review your top 5 skills from Step 2. Complete the Format Decision Matrix by assigning each skill to digital, blended, or live-only categories. Calculate the total budget split (aim for 70/30 digital/blended) and create a 12-week build calendar with specific start/end dates for each deliverable.
Step 4: Build Digital Components

Execute 8-10 minute micro-burst formula proven to deliver 60% retention vs 20% slide decks.
- Hook grabs attention with business stakes
- Demo uses branching scenarios (choose-your-path)
- Practice delivers scored feedback loops
- Action assignments create immediate application
- Mobile-first HTML5 ensures workflow access
Tech Execution:
Tools: Articulate Rise + xAPI LMS
Structure: 20% hook, 40% demo, 20% practice, 20% action
Success Metric: 85% completion, 70% pass rate
Microlearning Module Blueprint
- Hook (90 sec): “This skill closes 23% more deals. Watch Sarah lose $50K…”
- Demo (3 min): Interactive walkthrough—3 decision branches
- Practice (3 min): 5 scored scenarios—instant remediation
- Apply (90 sec): “Execute tomorrow 10AM call using Technique #2”
Action: Select your highest-priority skill from Step 3. Write the complete 8-10 minute module script using the exact blueprint formula above. Build the prototype in Articulate Rise (or equivalent tool). Test with 5 representative users and iterate based on their feedback.
Step 5: Engineer Blended Architectures

- 70% digital foundation builds knowledge scale
- 30% live reinforcement cements behaviour change
- Sequence prevents overload: spaced digital → concentrated practice → spaced nudges → certification
- Coach ratios (1:12) deliver workshop impact at 75% lower cost
- Certification creates stakes and proof points
6-Week Hybrid Sequence
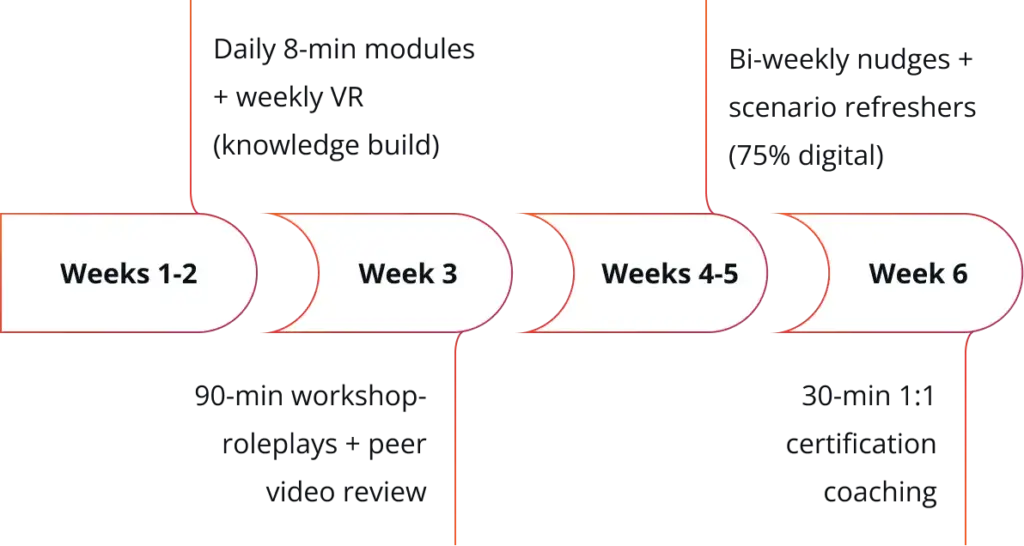
Action: Block all 6 weeks in your team calendar—mark the exact dates for digital releases, workshops, and coaching sessions. Identify and confirm the availability of 1 coach per 12 learners. Reserve workshop room/Zoom link and send calendar invites to all participants. Prepare workshop agenda using the provided sequence.
Step 6: Construct ROI Model

Use conservative Level 3 (behaviour) metrics, not fluffy Level 1 smile sheets.
- Anchor productivity gains to salary data
- Time savings to actual hours tracked
- Adoption revenue to CRM/app data
- Show 3 scenarios (base, upside, downside) for credibility
- Formula bulletproofs against “prove it works” objections
ROI Calculation Worksheet
| Component | Formula | Your Input | Conservative | Optimistic |
|---|---|---|---|---|
| Productivity Gain | Headcount x Salary x 25% | 200 x $85K x 0.25 | $4.25M | $5.1M |
| Time Savings | Hours x Rate x People | 120 x $50 x 200 | $1.2M | $1.5M |
| Adoption Revenue | Usage x Revenue/User | 38% x $2K x 500 | $3.8M | $4.75M |
| Total Benefits | Sum | $9.25M | $11.35M | |
| Total Cost | All expenses | $250K | $250K | $250K |
| Net ROI | (B-C)/C | 3,600% | 4,440% |
Action: Pull exact headcount, salary, and current KPI data from HR/Finance systems. Input all numbers into the ROI worksheet, running both conservative and optimistic scenarios. Create a crisp 3-slide executive summary (Problem → Solution → ROI projection) and schedule a 15-minute preview with your CFO or equivalent decision-maker.
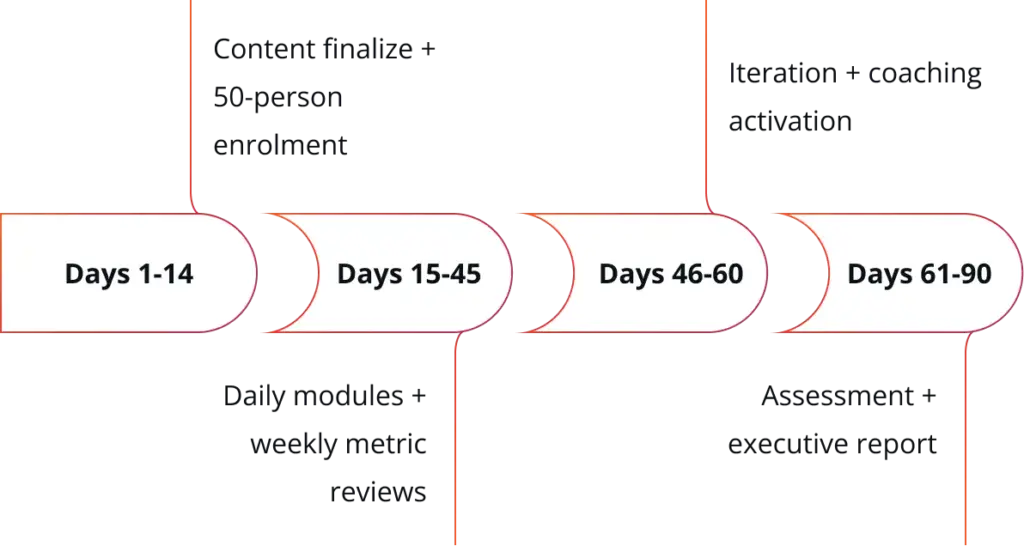
Step 7: Launch 90-Day Pilot

A tight 50-person cohort proves the concept without enterprise risk.
- Daily delivery builds habit
- Weekly metrics catch issues early
- Mid-pilot coaching prevents dropout
- Final assessment delivers proof points
Decision framework: scale if KPI moves >20%, iterate if 10-20%, kill if <10%.
Pilot Timeline
5 Weekly Metrics
- Completion (>85%)
- Confidence (+30%)
- KPI movement
- NPS (>8)
- Cost/learner (<$500)
Action: Create a 50-person pilot cohort list from your highest-impact team. Send personalized enrolment emails explaining business stakes and time commitment (3 hours total over 90 days).
Set up automated weekly metric tracking in Google Sheets or LMS dashboard. Schedule standing 15-minute Friday metric review meetings with 2-3 key stakeholders starting Day 15.
Step 8: Scale Proven Winners

- Replicate the exact pattern to new audiences
- Localize scenarios/language but preserve structure
- Phase timing prevents overload; one new group quarterly
- Standardization creates a playbook-within-playbook for future programs
Horizontal Scale Matrix
| Phase | Team Size | Audience | Localization | Launch Date |
|---|---|---|---|---|
| Pilot+1 | 200 | Marketing | English | Mar 1 |
| Q2 | 1,000 | APAC Sales | 3 languages | Apr 15 |
| Q3 | 5,000 | Global Ops | 7 languages | Jul 1 |
Action: Review Week 8 pilot metrics to confirm >20% KPI movement. Identify your Phase 2 audience (next highest business impact) and exact launch date. Duplicate the entire program structure from pilot (content, timeline, coaching ratios). Assign the program manager and begin localization planning (if needed) immediately after confirmation of pilot success.
Step 9: Deploy Simple Analytics

- Executives need 3 needles, not a haystack
- Automate weekly pulls from LMS/CRM
- Green/yellow/red status prevents gaming
- A single slide monthly tells the full story
Executive Dashboard Template
| Metric | Target | Wk4 | Wk8 | Wk12 | Status |
|---|---|---|---|---|---|
| ROI Projection | 300%+ | 180% | 320% | 420% | 🟢 |
| Adoption Rate | 75% | 62% | 78% | 89% | 🟢 |
| Primary KPI | +25% | +12% | +28% | +35% | 🟢 |
Action: Build this exact dashboard in Google Sheets using pilot enrolment data as placeholders. Connect to LMS/CRM APIs for automated weekly data pulls (or set recurring manual exports). Create a one-click “Executive View” tab with just the 3 key metrics and traffic light status. Test the automation and schedule your first leadership update for the end of Week 4.
Step 10: Review Execution Checklist

Secure lasting ROI with our 10-point Digital & Blended Mastery checklist—your final quality gate before full-scale rollout.
Digital & Blended Mastery
| # | Task Item | Check |
|---|---|---|
| 1 | Defined 1 revenue outcome + baseline | ☐ |
| 2 | Mapped 3 skills to workflow triggers | ☐ |
| 3 | Assigned digital/blended formats + budget | ☐ |
| 4 | Built 1 micro-module prototype | ☐ |
| 5 | Designed 6-week hybrid sequence | ☐ |
| 6 | Completed ROI worksheet (>200%) | ☐ |
| 7 | Launched 50-person pilot | ☐ |
| 8 | Tracked 5 weekly metrics | ☐ |
| 9 | Generated executive deck | ☐ |
| 10 | Scheduled Phase 2 scale | ☐ |
Results: 25% performance lift. 353% ROI proven.
Ready to turn insight into action? Connect with Wordsburg to discover how CHROs and L&D leaders deploy this Digital & Blended Learning Playbook—leveraging transformation diagnostics and readiness assessments to refine strategic planning and portfolio reviews—then select the optimal self-administered or facilitated rollout for 353% ROI in 90 days.
Recommended
Explore our strategic 4-Step ROI Framework — trusted by CFOs, required by MAS/RBI audits, and endorsed by Boards. Grounded in compliance-driven best practices, it reveals the principles delivering 269% ROI against industry benchmarks. Calculate now to access instant ROI tools, benchmark data, CFO-ready summaries, and actionable guides to prove training impact and secure budget approval.